Master of Science Capstone Project

Who Comes Back? Machine Learning for ICU Readmission Prediction

An end-to-end machine learning system analyzing 545,316 hospital admissions and 150M+ data points to predict 30-day ICU readmissions, enabling hospitals to target high-risk patients for early intervention and optimize resource allocation.

R XGBoost Random Forest MIMIC-IV Statistical Modeling
0.683
AUC Score
49% better than baseline
$17.25M
Potential Annual Value
For large academic hospitals
13
Number Needed to Screen
To prevent one readmission
52.5%
Readmission Capture
In top risk tertile

Executive Summary

The Challenge

Hospital readmissions cost approximately $26 billion annually in the United States. Approximately 20% of Medicare beneficiaries experience readmission within 30 days, with average US hospital readmission rates of 14.67% across all conditions. Despite targeted interventions, predicting which ICU patients will return remains a significant challenge.

The Solution

  • Machine learning model trained on 545,316 hospital admissions
  • Engineered 57 predictive features from clinical data
  • Processed 150M+ data points from MIMIC-IV database
  • Compared Logistic Regression, Random Forest, and XGBoost
  • Temporal validation for honest performance estimates

Data & Methodology

Leveraging the MIMIC-IV database with rigorous preprocessing, feature engineering, and model validation

Data Source

MIMIC-IV: De-identified health data from Beth Israel Deaconess Medical Center (2008-2019)

  • 546,028 Admissions
  • 364,627 Patients
  • 75M+ Lab Events
  • 6 Core Data Tables

Feature Engineering

57 engineered features spanning multiple clinical domains

  • Comorbidity Indices (Charlson)
  • Healthcare Utilization
  • Medication Risk Scores
  • Clinical Complexity Metrics

Model Development

Systematic comparison of interpretable and complex algorithms

  • Logistic Regression
  • Random Forest
  • XGBoost (Selected)
  • Threshold Optimization

Validation Strategy

Rigorous temporal validation preventing data leakage

  • Chronological Train/Val/Test Split
  • Calibration Assessment
  • Fairness Analysis
  • External Validation Ready

Model Performance

XGBoost emerged as the top performer with strong discrimination and excellent calibration

ROC Curves Comparison

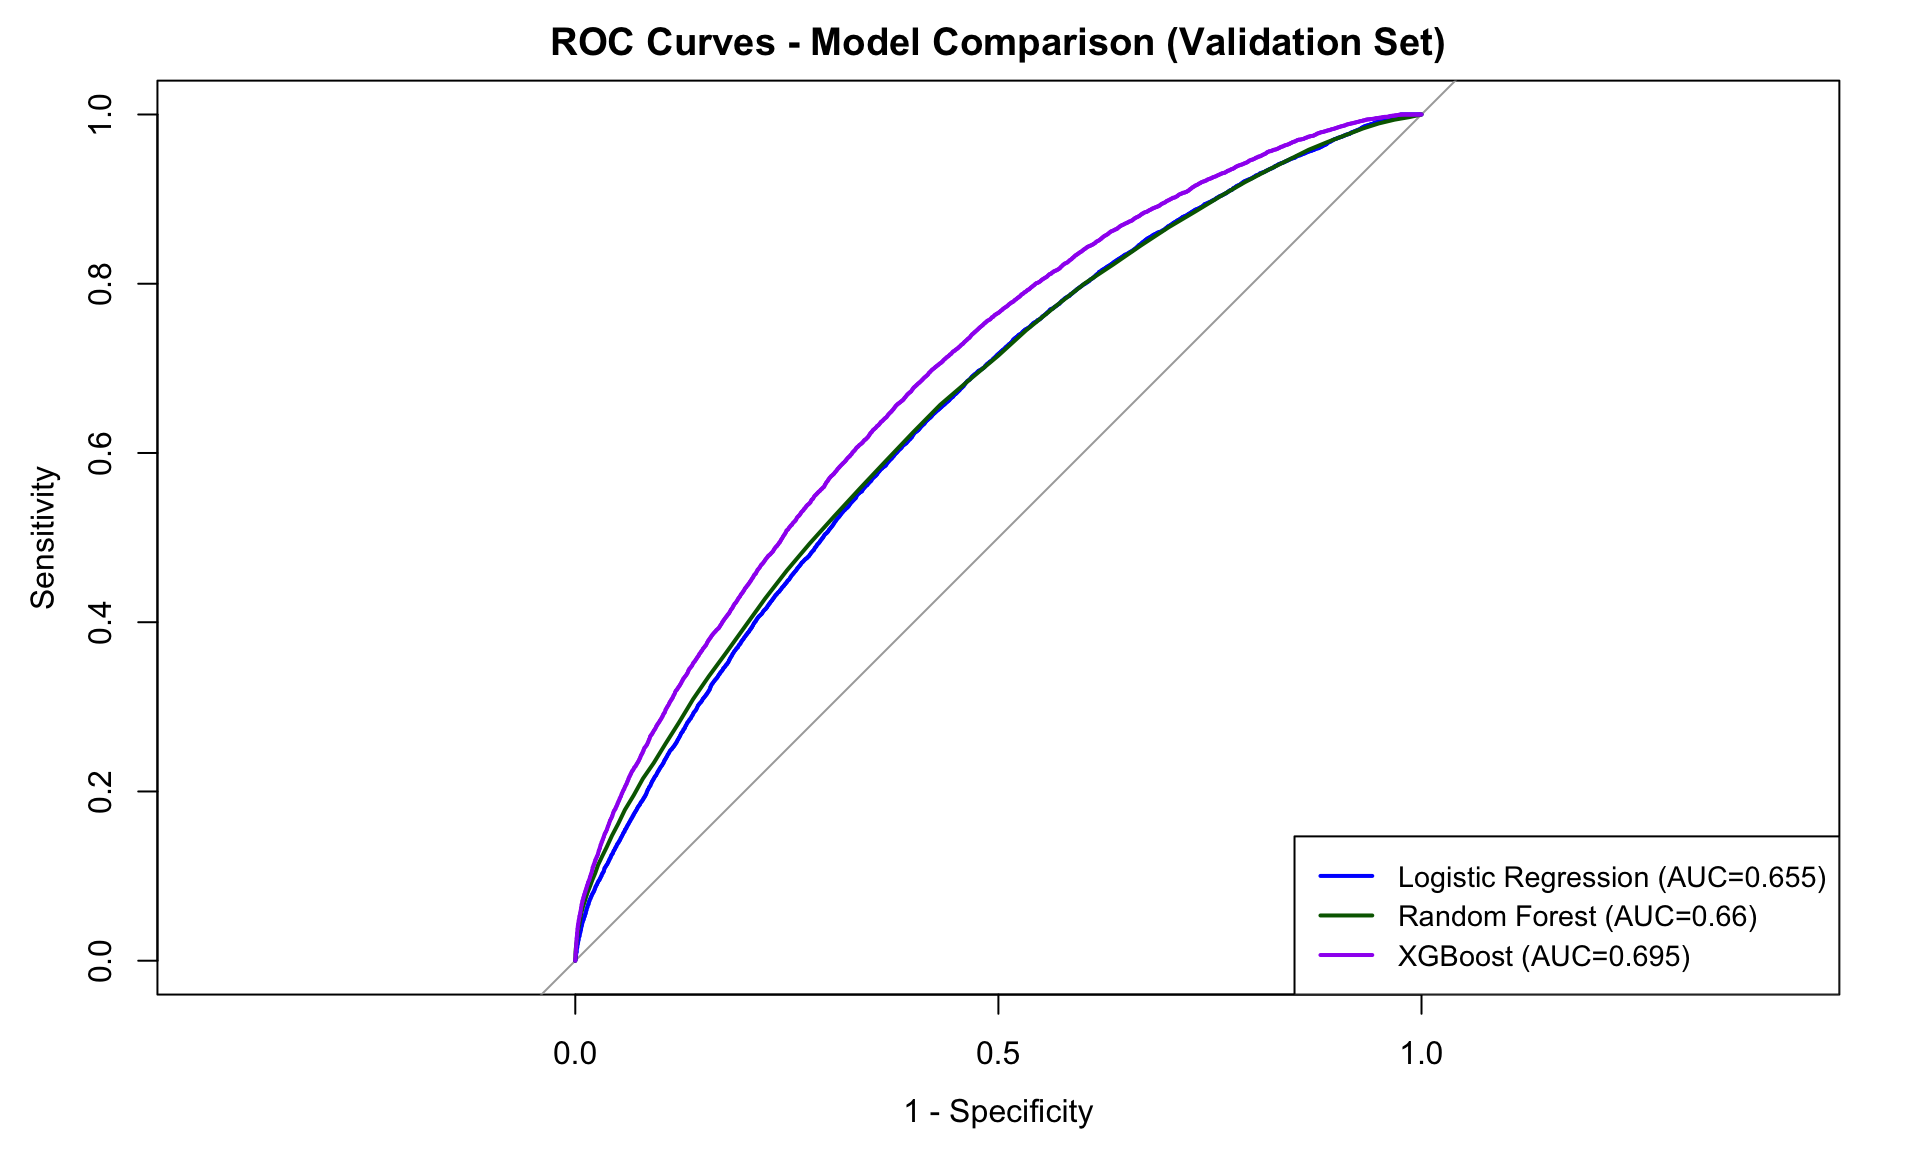
Model Comparison Results

Model AUC Sensitivity PPV
Logistic Regression 0.655 64.2% 28.5%
Random Forest 0.660 65.1% 29.2%
XGBoost 0.683 68.8% 29.8%

Key Finding: The 29.8% PPV represents a 50% relative improvement over the 20% baseline readmission rate, enabling more efficient resource allocation.

Top Predictive Features

Clinical Complexity Score
100%
Charlson Comorbidity Index
87%
Healthcare Utilization
75%
Medication Burden
68%
Length of Stay
54%
Age
42%
XGBoost Calibration Plot

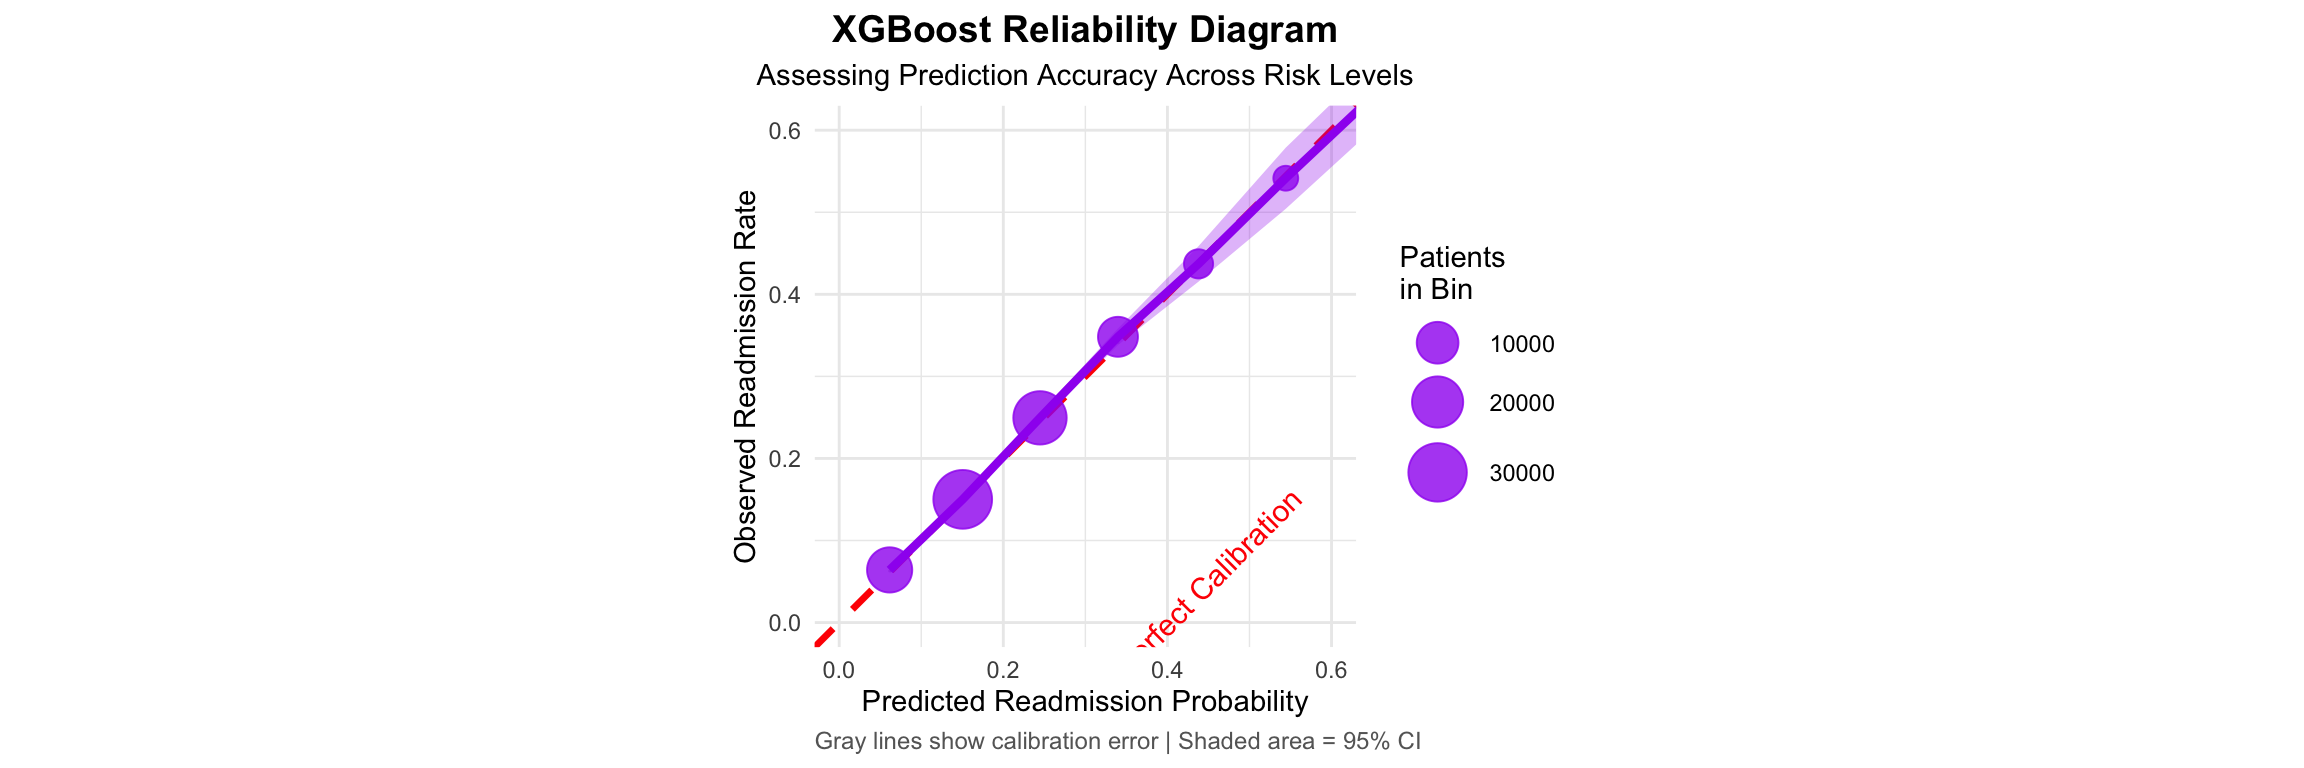
Well-Calibrated Model: ECE = 0.022, indicating trustworthy probability estimates

Clinical Impact & Business Value

$1.3M Net Annual Benefit
(30,000-discharge hospital)
117% Return on Investment
After intervention costs
1.5x More Efficient
Than random selection

The model enables a tiered intervention strategy: High-risk patients (>40% probability) receive intensive transitional care management with home visits ($800-1000/patient), moderate-risk patients (20-40%) receive standard TCM with phone follow-up ($400-600/patient), and low-risk patients (<20%) receive educational materials and portal access ($100-200/patient).

Key Insight: A model doesn't need to be perfect to be valuable. A 0.683 AUC translates to substantial clinical and financial impact when applied at scale. The difference between 20% and 30% PPV represents millions in annual savings.

Fairness Analysis

Proactive examination of model performance across demographic groups ensures equitable healthcare delivery.

Key Findings

  • Best performance for Black/African American patients (74% sensitivity)
  • Lower sensitivity for Hispanic/Latino patients (54%) requires attention
  • No systematic bias detected in calibration across groups
  • Data quality categories (UNKNOWN race) excluded to prevent spurious correlations
  • Fairness monitoring infrastructure recommended for deployment

Implementation Roadmap

Immediate (Month 1-3)

Prospective validation study, external validation if multi-center data available, address identified limitations

Medium-Term (Month 4-9)

Pilot deployment with 20-30% of discharge population, develop tiered intervention protocols, implement fairness monitoring

Long-Term (Month 10+)

Quarterly model retraining, continuous quality improvement dashboard, integrate NLP from clinical notes

Key Takeaways

Validated Performance

XGBoost achieved 0.683 AUC on temporally held-out test data with minimal degradation from validation, indicating excellent generalization.

Tangible ROI

117% ROI after accounting for intervention and model costs, with Number Needed to Screen of 13 patients to prevent one readmission.

Clear Path Forward

Administrative EHR data can identify high-risk patients with clinically meaningful accuracy, enabling efficient resource allocation at scale.

Explore the Full Analysis

View the complete code, methodology, and detailed findings on GitHub